
This post appeared originally in our sysadvent series and has been moved here following the discontinuation of the sysadvent microsite
Apache JMeter is a nice little tool with tons of functionality for testing web sites. It can be used both for stress testing and functional testing. This tutorial is going to show you how to set it up and get started with some basic stress testing.
Installation and initial setup
First, go to the official Apache JMeter website and download the binary, and unpack it on the machine you will be running the test from (your workstation/laptop should be enough to start with). The only software requirement is that you have java (JVM) 6 or higher installed. As such, JMeter can be run on any operating system that has a compliant java implementation.
We are going to use the GUI interface for JMeter in this tutorial. It is also possible to run the software from command line.
Once you have unpacked the binary package, go to the bin directory and start JMeter with jmeter.bat (on Windows systems) or jmeter.sh (on *NIX).
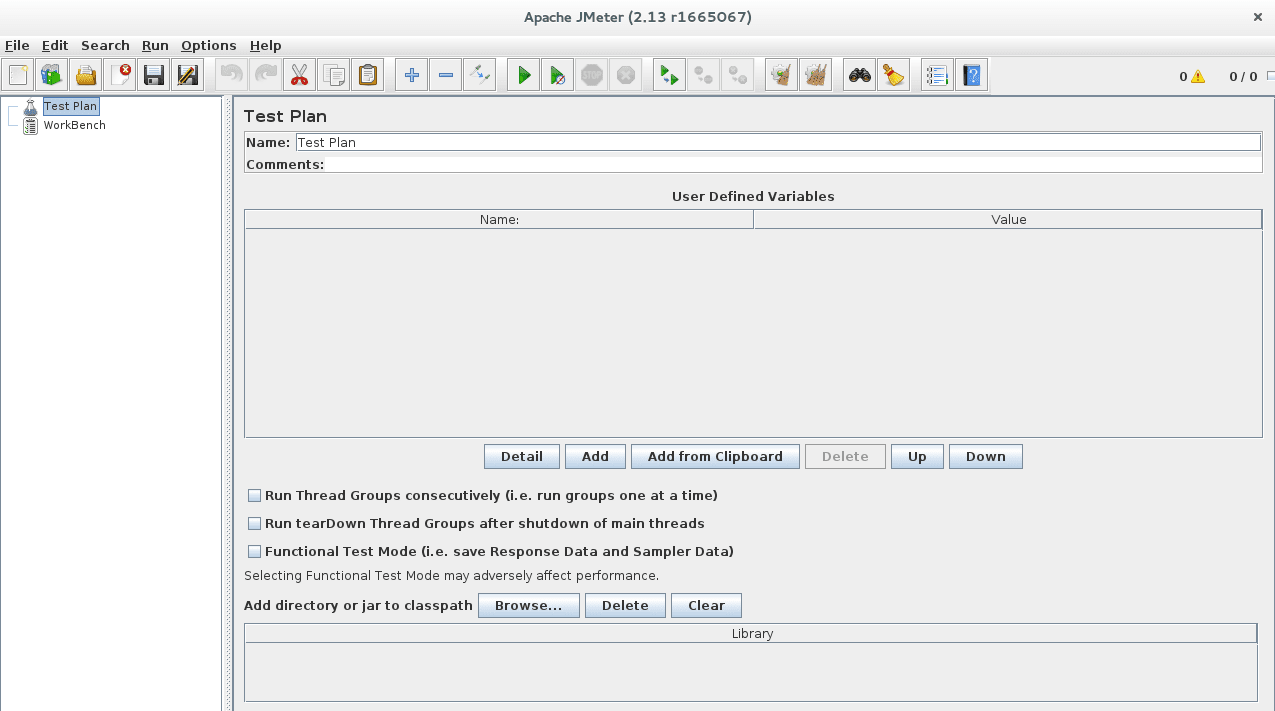
Let us give our project a new name, “Stress test of redpill-linpro.com”. The first thing we want to do then is create a new Thread Group. Right click on “Stress test of redpill-linpro.com” in the left column, and go to Add -> Threads (Users) -> Thread Group. The Thread Group will include a set of tasks that we want the test to complete. If you have many different functionalities you would like to test it may be smart to divide them into different Thread Groups, but for now we will look at one.
There are a few basic elements which can be nice to include at this point. First off, include the configuration element HTTP Request Defaults, which has a pretty self explanatory name. For now we will only set one default, redpill-linpro.com in the “Server Name or IP” field.
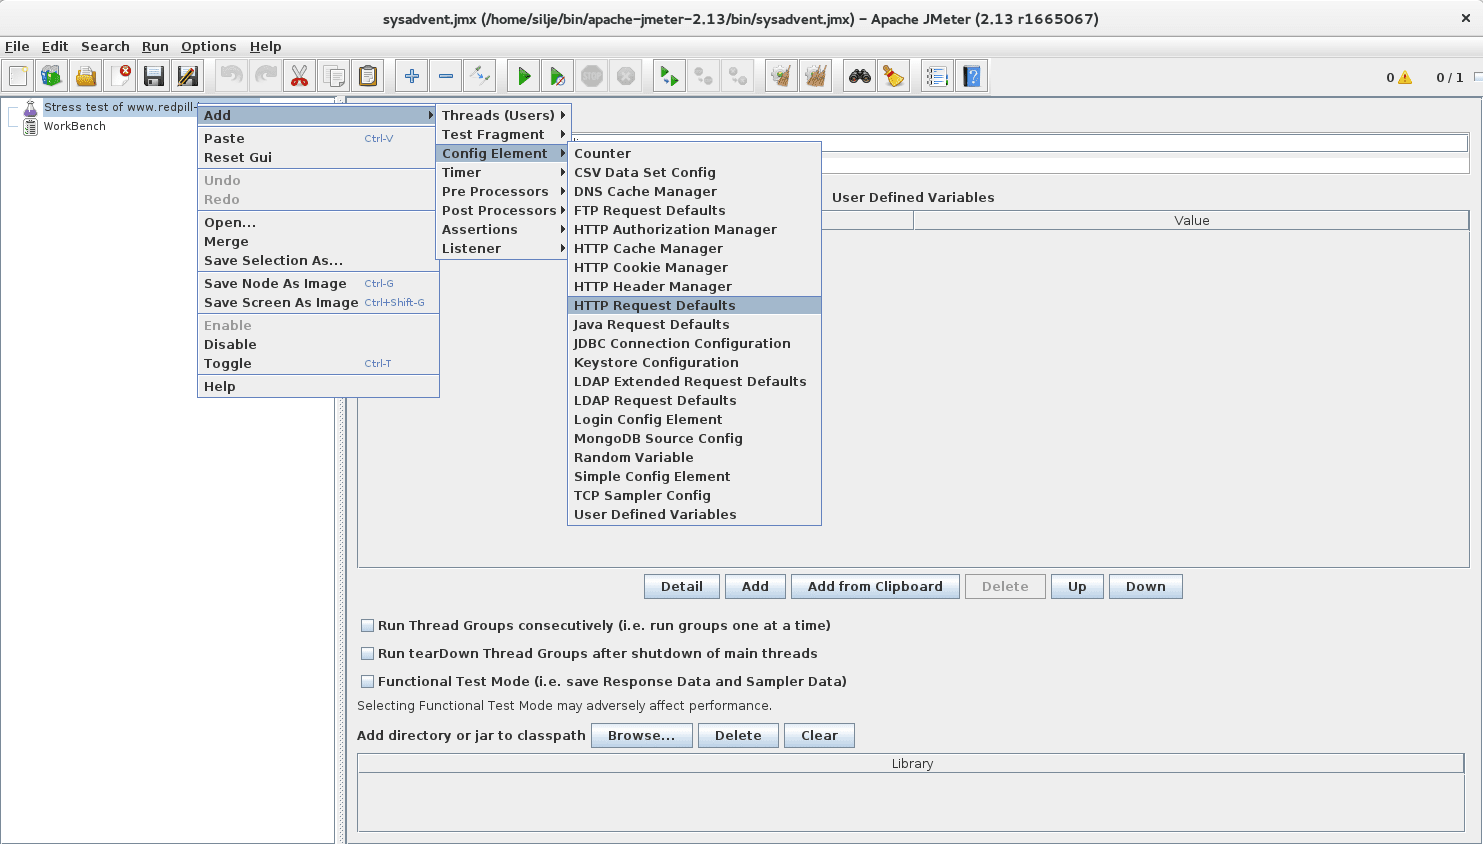
It is also smart to add the HTTP Cookie Manager from the same menu. The Cookie Manager will keep track of the cookies received for each thread of requests. Tick the “Clear cookies each iteration?” box. You can of course skip this if the site you are testing does not have cookies.
Finally add a Thread Group (Add -> Threads(Users) -> Thread Group). This is where the requests will be defined. We will name the Thread Group “My Test”. Also, add a Recording Controller (Add -> Logic Controller -> Recording Controller), which will be used as a receiver for the recording described in the next section.
Setting up your test
For building the test JMeter has a nice recording tool included. It is set up as a proxy service which you then direct your browser traffic through to record a manual walkthrough of the requests you wish to test.
First add the Non-test Element “HTTP(S) Test Script Recorder” to the Workbench. This is the element where you set up the proxy service/recorder. You can use most of the default values, but choose “Stress test of redpill-linpro.com > My Test > Recording Controller” from the “Target Controller” pull-down menu. We will also exclude image files, CSS, JavaScript and other stuff that are not really interesting. Add the following URL patterns to the exclude list:
(?i).*\.(bmp|css|js|gif|ico|jpe?g|png|swf|woff)
(?i).*\.(bmp|css|js|gif|ico|jpe?g|png|swf|woff)[\?;].*
Before starting the recorder you will need to set up your browser to use the proxy service. In Firefox you can configure this under Preferences -> Advanced -> Network -> Settings. The HTTP Proxy address is “localhost” and the port is 8080 (unless you changed it in the recorder settings). You can also use the FoxyProxy extension which is available for both Firefox and Chrome. If you are unsure how to configure this, a quick search online should get you started.
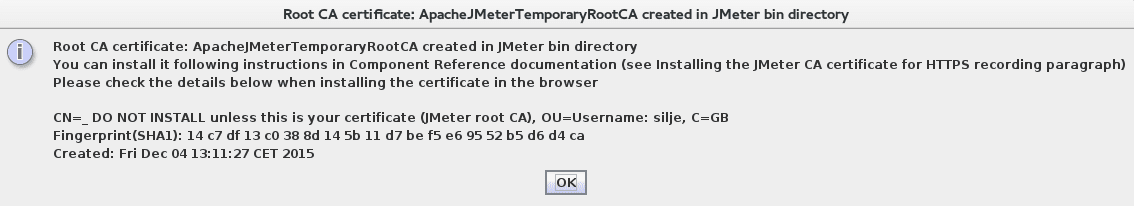
When the proxy settings are all set up, start the recorder, go to your website and go through the requests you want to stress test manually. When you start the recorder a message box opens that tells you a CA certificate has been created and where it is located. You will need to import this certificate in your browser if your website has elements from other domains which you wish to include in the test requests. Otherwise you will get a security warning from the browser due to the traffic being proxied.
Hot tip! You may want to close all other browser windows/tabs while doing the recording so you do not get any unrelated traffic recorded. It is also possible to configure FoxyProxy to only proxy traffic to a specific site.
Once you are done going through the request you can stop the recorder. You should now have a set of requests listed under the “My Test” Thread Group.
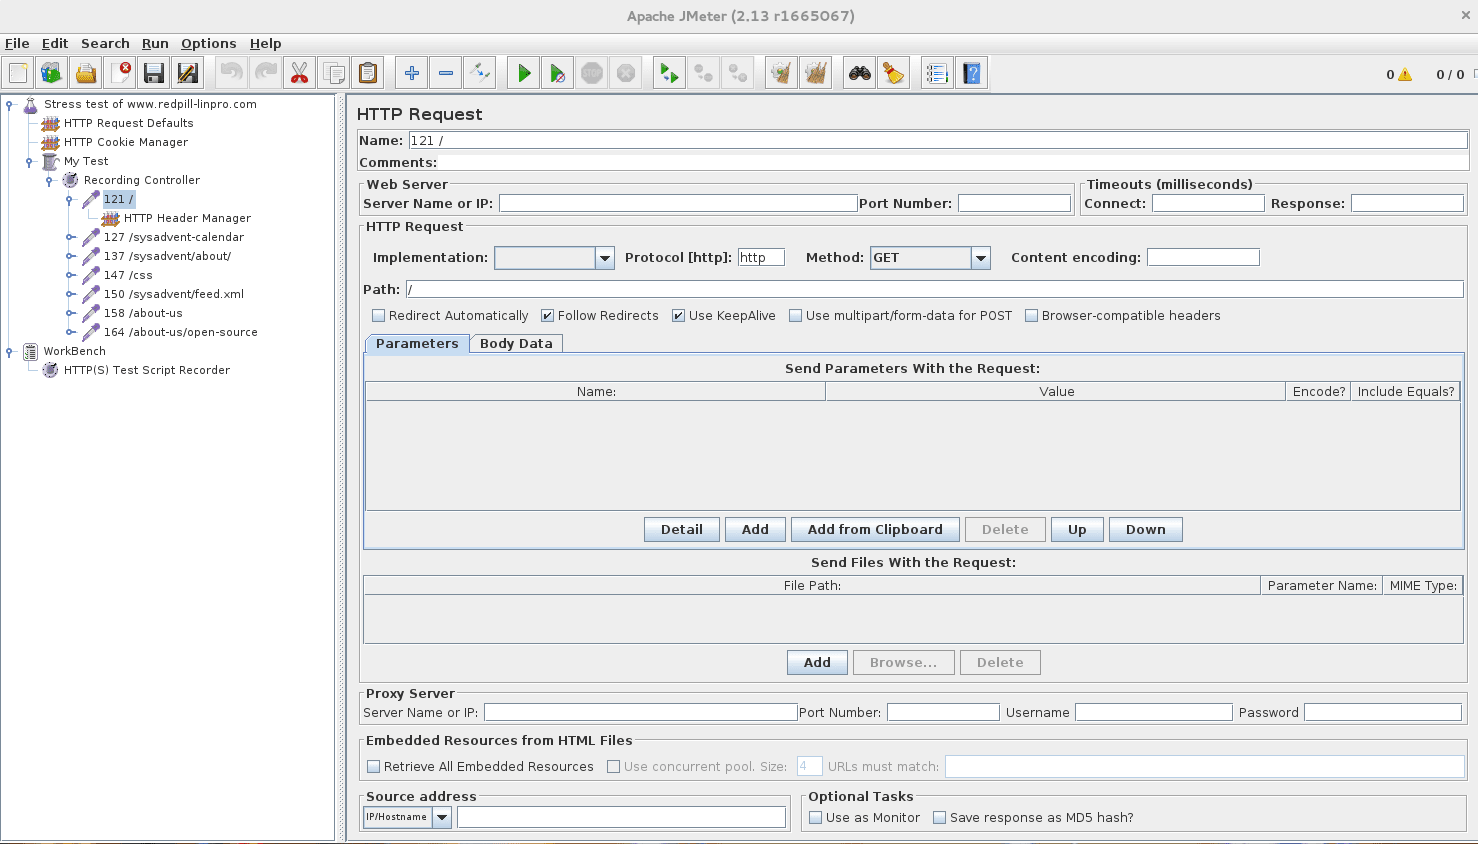
Each request can be modified, and it is also possible to modify the request header. The /css request in the above screenshot is actually a request to fonts.googleapis.com. We will remove this (right click -> Remove) as we do not want to stress test any other servers than our own.
Running the test
Once we have the requests we want in the way we want them, we can finally start the testing. JMeter have a lot of functionality for adapting the testing so as to be as realistic as possible. For now we will only add a Uniform Random Timer (right click on the main element -> Add -> Timer -> Uniform Random Timer) to give us a nice time distribution of the tests. Let us say you want to simulate a thousand requests. Without the timer all of these will be sent at the exact same millisecond, which rarely happens in reality.
We will set “Random Delay Maximum” to 3000 milliseconds and “Constant Delay Offset” to 300 milliseconds. Experiment and adapt these numbers to something like what you expect to receive at your site.
Continue on to configure the “My Test” element. Set the number of users you want to simulate and the number of loops you want the test to run in.
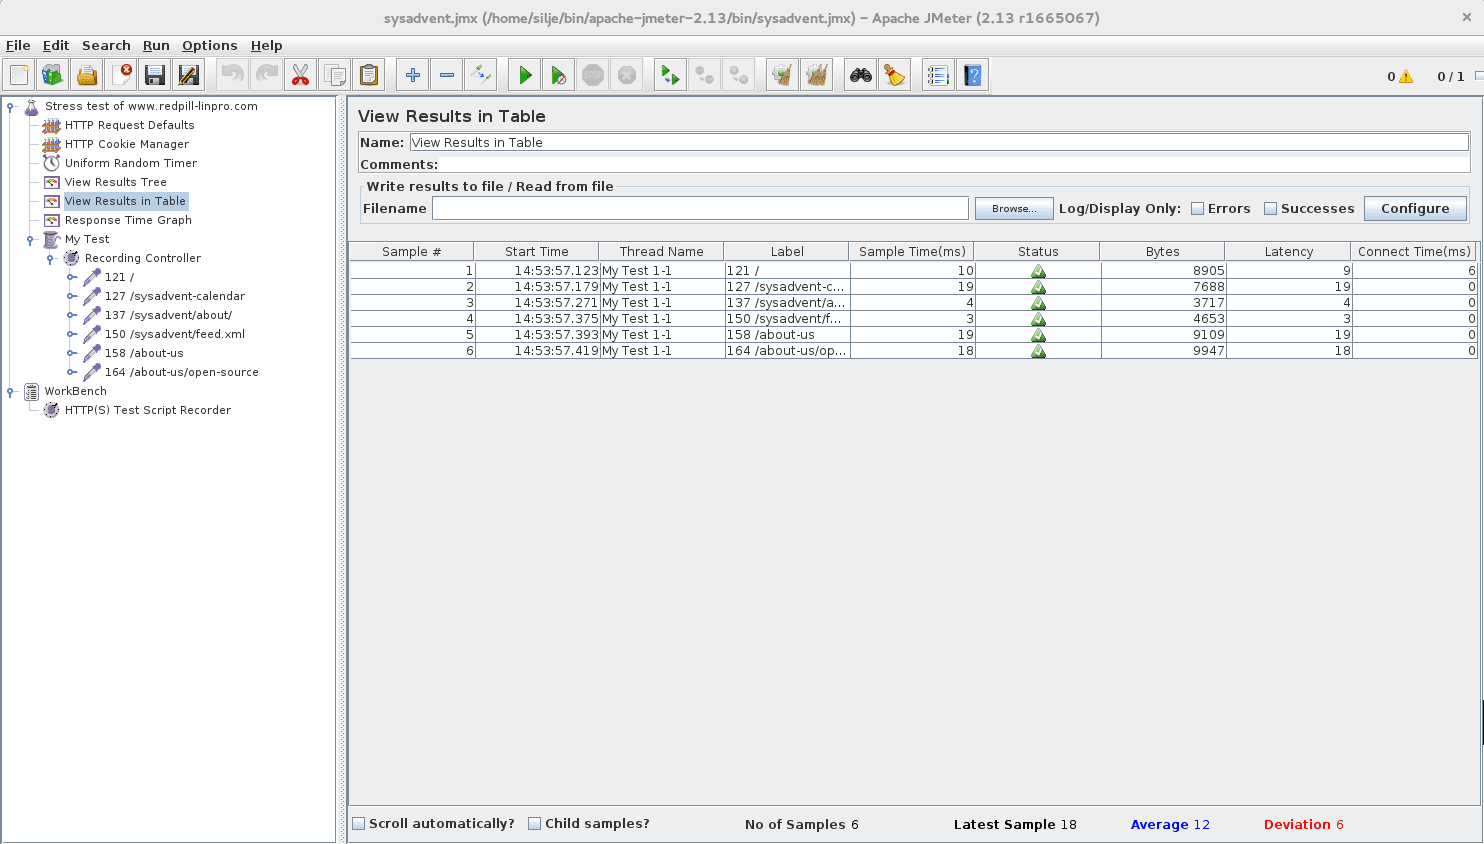
Finally we will add a couple of elements that will let us view the results. Right click on “Stress test of redpill-linpro.com” -> Add -> Listener. “View Results Tree” and “View Results in Table” will both show if the request was successful. The first will show the response data, while the second will list useful information like latency and bytes transferred. Another useful listener is “Response Time Graph” which will graph the response time for all the threads the test has completed.
Now all you have to do is press the play button on the tool bar and relax as the test runs its course.
It is also possible to do all this from command line, but that is outside the scope of this sysadvent post.
Testing other types of servers
JMeter can test web servers (as we have seen). but it can also be used to stress test your RESTful API servers or your SOAP implementation. In addition, JMeter can test other services using other protocols than HTTP(S) like:
- FTP servers
- Databases (via JDBC)
- MongoDB servers (NoSQL)
- LDAP servers
- JMS providers
- SMTP(S), POP3(S) and IMAP(S) servers
This list, and the full documentation for JMeter can be found at the official website.
Good luck testing your site!
Just-Make-toolbox
make is a utility for automating builds. You specify the source and the build file and make will determine which file(s) have to be re-built. Using this functionality in make as an all-round tool for command running as well, is considered common practice. Yes, you could write Shell scripts for this instead and they would be probably equally good. But using make has its own charm (and gets you karma points).
Even this ... [continue reading]