
This post appeared originally in our sysadvent series and has been moved here following the discontinuation of the sysadvent microsite
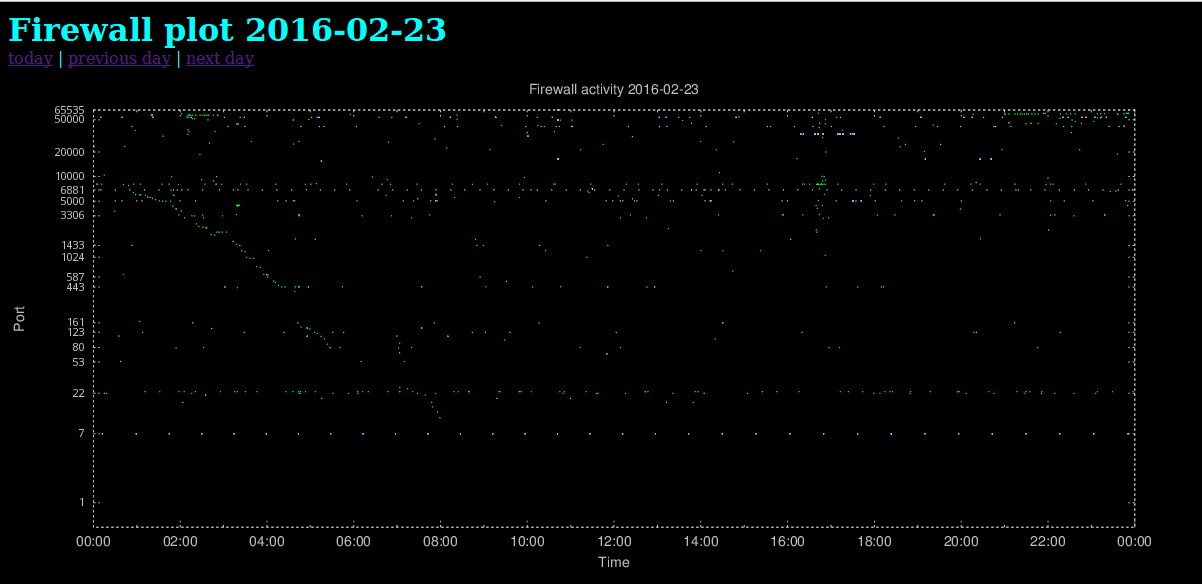
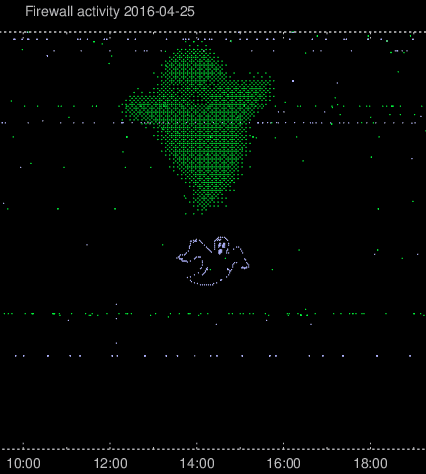
For some time now, I’ve been graphing all unsolicited network traffic destined for my network. For instance, it’s quite useful for detecting slow scans, which will show up as the diagonally aligned green scatter points in this plot (click to zoom):
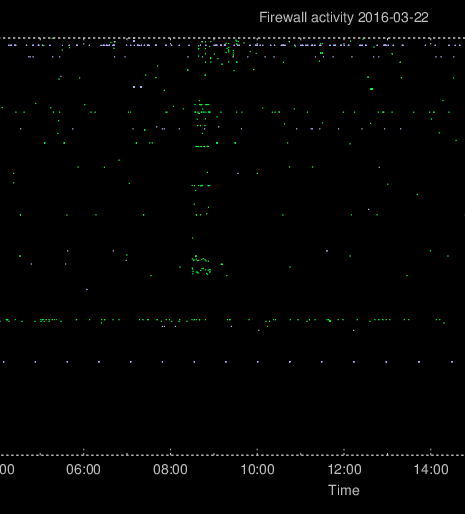
Other scans and probes often happen faster, when the attacker isn’t much concerned about being detected. These will appear in the plot as a lot of vertically aligned scatter points. In the plot shown below, the attackers have scanned a limited set of ports for about 30 minutes.
Backfire time
After writing a previous blog article about the plots as well as discussing the setup with my colleagues, and even showing what can happen with such a feature, there was really no reason to act surprised when weird patterns started to appear in the firewall plots.
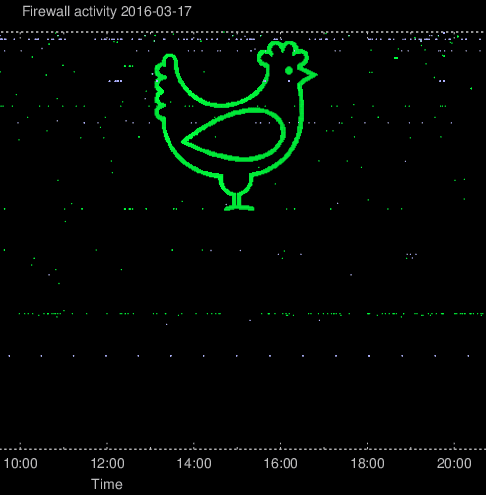
The first synchronized port scan resulted in a chicken. Because of the
logarithmic scale of the plot, the attacksdrawings will have
higher precision when aiming for the high ports.
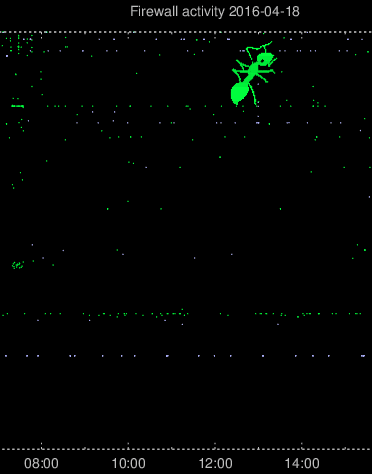
Then after a few weeks of just the normal hostile activity and a few not-so-successful creative port scans, a very well defined ant suddenly appeared.
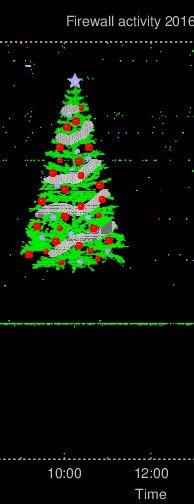
In the firewall plot, TCP connections will be plotted as green and UDP connections will be plotted as light blue. After a few poorly disguised questions regarding whether I was plotting other protocols and, if so, which colors they would be, it became evident that some new plan was being hatched. And, lo and behold:
After these creative scanning took place, I implemented support for graphing rejected/blocked IPv6 activity in other colours: IPv6/TCP in red and IPv6/UDP in white. Practical use aside, my feeling that a colleague would take up this as a challenge was correct:

Just-Make-toolbox
make is a utility for automating builds. You specify the source and the build file and make will determine which file(s) have to be re-built. Using this functionality in make as an all-round tool for command running as well, is considered common practice. Yes, you could write Shell scripts for this instead and they would be probably equally good. But using make has its own charm (and gets you karma points).
Even this ... [continue reading]