
This post appeared originally in our sysadvent series and has been moved here following the discontinuation of the sysadvent microsite
Monitoring Java applications can be a painful operation that often require lots of configuration, with technologies like byte code instrumentation and JMX, you can literally have thousands of Metrics to choose from just from a single Java application. This post will talk about JMole which has good sensible defaults that makes monitoring java applications much less painful.
JMole is an excellent monitoring client framework for gathering data dynamically from various Java MBeans (Java 6 and higher). It consists of a single JAR file that only need to be bootstrapped or if deployed in an Java Enterprise Application Server this is done automatically by a built-in Singleton Bean. The MBeans data is then exposed as using different monitoring-systems/protocols like:
Lets do a simple demo of the capabilities of what JMole is able to do for us! Apache tomcat is very easy to get up and running so we use it to test JMole. And present it to Munin to make some nice graphs for us.
For this we need Java (6 or higher) and Maven installed (for building) or grab the Mole artifacts directly from Sonatype: here
$ mkdir /tmp/demo ; cd /tmp/demo
$ wget http://www-eu.apache.org/dist/tomcat/tomcat-8/v8.5.6/bin/apache-tomcat-8.5.6.tar.gz
$ tar xvf apache-tomcat-8.5.6.tar.gz
$ git clone https://bitbucket.org/awelen/jmole.git
$ cd jmole
$ git checkout tags/1.2.1 -b 1.2.1
$ mvn package
....
[INFO] ------------------------------------------------------------------------
[INFO] Reactor Summary:
[INFO]
[INFO] JMole .............................................. SUCCESS [  0.145 s]
[INFO] JMole Core ......................................... SUCCESS [  5.239 s]
[INFO] JMole Web .......................................... SUCCESS [  0.349 s]
[INFO] JMole Mule ESB ..................................... SUCCESS [  2.646 s]
[INFO] ------------------------------------------------------------------------
[INFO] BUILD SUCCESS
[INFO] ------------------------------------------------------------------------
[INFO] Total time: 9.741 s
[INFO] Finished at: 2016-11-09T13:49:53+01:00
[INFO] Final Memory: 37M/973M
[INFO] ------------------------------------------------------------------------
Total build time of just under 10 seconds is not bad. Build is done. Now choose the artifact for JMole Web jmole-web/target/jmole-web-1.2.1.war which is used for Web Containers (Servlet 2.3) like our Tomcat - put it in Tomcat’s webapps directory.
We also need to copy the standard JMole configurations for Tomcat and for the JVM.
cp /tmp/demo/jmole-web/target/jmole-web-1.2.1.war /tmp/demo/apache-tomcat-8.5.6/webapps/
cp /tmp/demo/jmole/jmole-core/configs/JMole_Tomcat_8.xml /tmp/demo/apache-tomcat-8.5.6/conf/
cp /tmp/demo/jmole/jmole-core/configs/JMole_JVM.xml /tmp/demo/apache-tomcat-8.5.6/conf/
That’s all! Now we are ready to start tomcat. First we need to specify some JMole configuration parameters. This is done via the JAVA_OPTS environment variable, we add the JMole configuration for both Tomcat and for the JVM.
cd /tmp/demo/apache-tomcat-8.5.6/
JAVA_OPTS="-Djmole.config.filenames=/tmp/demo/apache-tomcat-8.5.6/conf/JMole_Tomcat_8.xml -Djmole.protocol.munin.enabled=true" bin/catalina.sh run
If you check the log file you should see something like:
25-Dec-2016 15:00:00.031 INFO [localhost-startStop-1] org.apache.catalina.startup.HostConfig.deployWAR Deploying web application archive /tmp/demo/apache-tomcat-8.5.6/webapps/jmole-web-1.2.1.war
...
25-Dec-2016 15:00:00.356 INFO [localhost-startStop-1] net.welen.jmole.Lifecycle.setup Starting JMole
25-Dec-2016 15:00:00.360 INFO [localhost-startStop-1] net.welen.jmole.JMole.configure Configuring JMole with config file: /tmp/demo/apache-tomcat-8.5.6/conf/JMole_Tomcat_8.xml
...
With tomcat started we now have a Munin-node (via JMole) listening on port 4949, lets try it!
$ echo "fetch jmole" | nc localhost 4949
# munin node at 127.0.0.1:4949
multigraph Requests___ajp_nio_8009_
requestCount.value 0.0
errorCount.value 0.0
multigraph Requests___http_nio_8080_
requestCount.value 967.7655856692489
errorCount.value 0.733155746719128
multigraph Requests____localhost_examples_async3
requestCount.value 302.06016764828075
errorCount.value 0.0
...
multigraph Connection_pool___http_nio_8080_
keepAliveCount.value 2
maxKeepAliveRequests.value 100
connectionCount.value 2
maxConnections.value 10000
...
JMole is alive and sends us metrics acting as a Munin node. To start using it you just need to add JMole Munin-node to Munin (I’ll leave the installation and configuration of Munin as an exercise to the reader), example configuration:
[JMole]
address localhost
port 4949
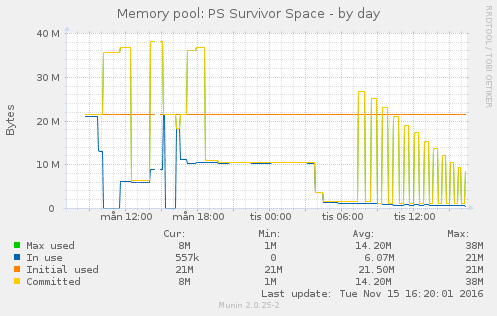
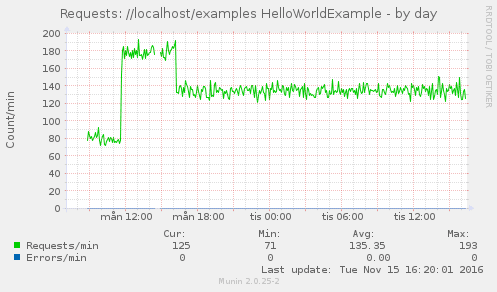
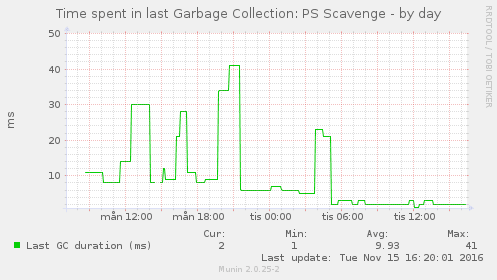
Which will get picked up by Munin and will generate quite a lot of graphs for us:
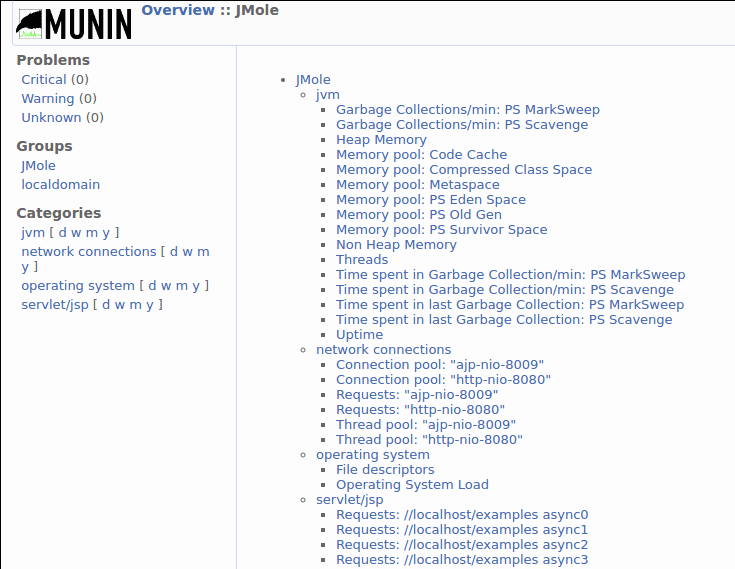
And after about a day or so we will get some nice graphs:
But wait! JMole also supports NRPE native, so we can use Nagios/Icinga to monitor our JVM/Web Container Runtime. To start the NRPE “client” we have to add -Djmole.protocol.nrpe.enabled=true to JAVA_OPTS, so starting tomcat now looks like:
JAVA_OPTS="-Djmole.config.filenames=/tmp/demo/apache-tomcat-8.5.6/conf/JMole_Tomcat_8.xml -Djmole.protocol.munin.enabled=true -Djmole.protocol.nrpe.enabled=true" bin/catalina.sh run
Here are some example uses:
# Check warnings
$ ./check_nrpe -n -H 127.0.0.1 -c checkWarnings
OK - No problems detected.

# Check criticals
$ ./check_nrpe -n -H 127.0.0.1 -c checkCriticals
OK - No problems detected.

# Lets check JVM threads, warn if over 200 and critical over 500
$ ./check_nrpe -n -H 127.0.0.1 -c getValue -a JVM Threads ThreadCount 200: 500:
OK - JVM/Threads/ThreadCount=121

# Test for warning 100 and critical 130
$ ./check_nrpe -n -H 127.0.0.1 -c getValue -a JVM Threads ThreadCount 100: 130:
WARNING - JVM/Threads/ThreadCount=110

# Test for critical (100)
$ ./check_nrpe -n -H 127.0.0.1 -c getValue -a JVM Threads ThreadCount 50: 100:
CRITICAL - JVM/Threads/ThreadCount=110

# To check without thresholds
$ ./check_nrpe -n -H 127.0.0.1 -c getValue -a JVM Threads ThreadCount 0:0 0:0
OK - JVM/Threads/ThreadCount=121

# Get JVM uptime
$ ./check_nrpe -n -H 127.0.0.1 -c getValue -a JVM Uptime Uptime 0:0 0:0
OK - JVM/Uptime/Uptime=6232566

# Get Time spent in last Garbage Collection: PS MarkSweep
$ ./check_nrpe -n -H 127.0.0.1 -c getValue -a JVM "Time spent in last Garbage Collection: PS MarkSweep" duration 0:0 0:0
OK - JVM/Time spent in last Garbage Collection: PS MarkSweep/duration=50
So with just one tool we are able to monitor our Java applications using different monitoring systems, very handy!
There are a lot of things that is possible to monitor, you can find more by the MBean net.welen.jmole:service=jmole, if you want more information or read up on how to configure JMole to monitor exactly what you need, read more at JMole’s Wiki

From a Luddite to a Vibe-Coder
For those who are unfamiliar with the word “luddite”, it was an organized movement of unemployed textile workers being against progress and sabotaging equipment like the power loom in the post banner. We don’t do sabotage, but we’re also not unemployed … yet! On the other hand, many of us seem to be struck by the Ostrich effect.
The modern luddite attitude to AI
It proved difficult to find an image of an ostrich with the head ... [continue reading]